How to profile Databend
flame graph
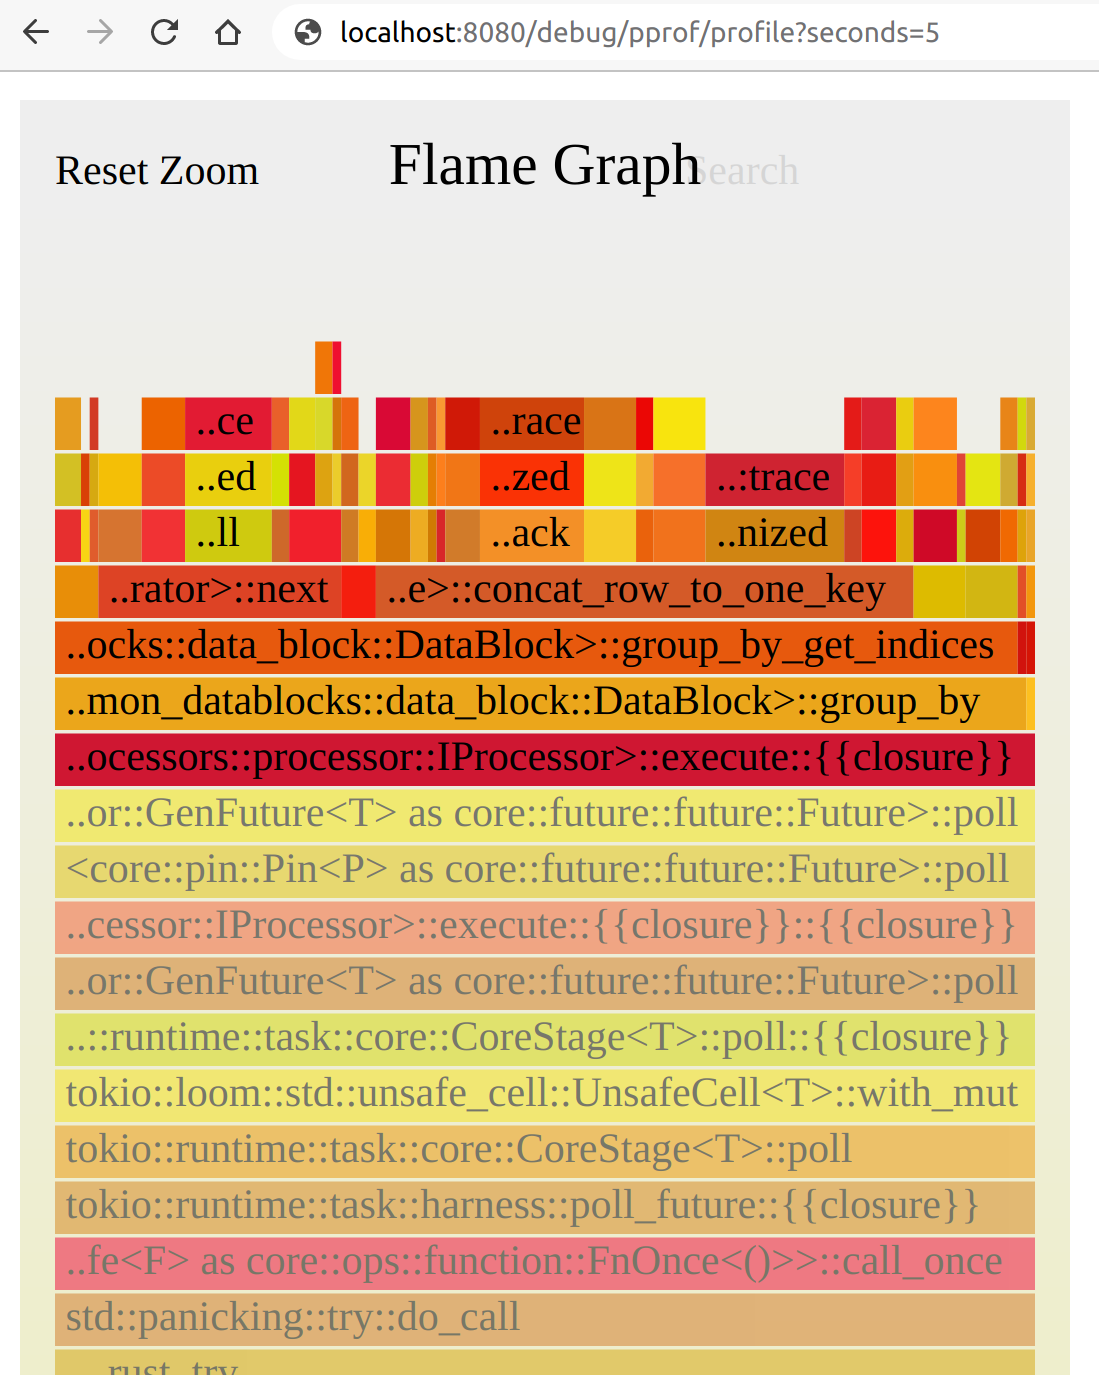
Open http://localhost:8080/debug/pprof/profile?seconds=5 in browser, Databend debug api will response the svg of the flame graph to the client.

go pprof tool
go tool pprof http://localhost:8080/debug/pprof/profile?seconds=20
Fetching profile over HTTP from http://localhost:8080/debug/pprof/profile?seconds=20
Saved profile in /home/bohu/pprof/pprof.cpu.007.pb.gz
Type: cpu
Entering interactive mode (type "help" for commands, "o" for options)
(pprof) top
Showing nodes accounting for 5011, 100% of 5011 total
Dropped 248 nodes (cum <= 25)
Showing top 10 nodes out of 204
      flat  flat%   sum%        cum   cum%
      5011   100%   100%       5011   100%  backtrace::backtrace::libunwind::trace
         0     0%   100%        162  3.23%  <&alloc::vec::Vec<T,A> as core::iter::traits::collect::IntoIterator>::into_iter
         0     0%   100%         45   0.9%  <&mut I as core::iter::traits::iterator::Iterator>::next
         0     0%   100%         77  1.54%  <[A] as core::slice::cmp::SlicePartialEq<B>>::equal
         0     0%   100%         35   0.7%  <[u8; 8] as ahash::convert::Convert<u64>>::convert
         0     0%   100%        199  3.97%  <[u8] as ahash::convert::ReadFromSlice>::read_last_u64
         0     0%   100%         73  1.46%  <[u8] as ahash::convert::ReadFromSlice>::read_last_u64::as_array
         0     0%   100%        220  4.39%  <[u8] as ahash::convert::ReadFromSlice>::read_u64
         0     0%   100%        701 13.99%  <ahash::fallback_hash::AHasher as core::hash::Hasher>::write
         0     0%   100%         26  0.52%  <ahash::random_state::RandomState as core::hash::BuildHasher>::build_hash
Or
go tool pprof -http=0.0.0.0:8081 $HOME/pprof/pprof.cpu.007.pb.gz